19 Jul 2022

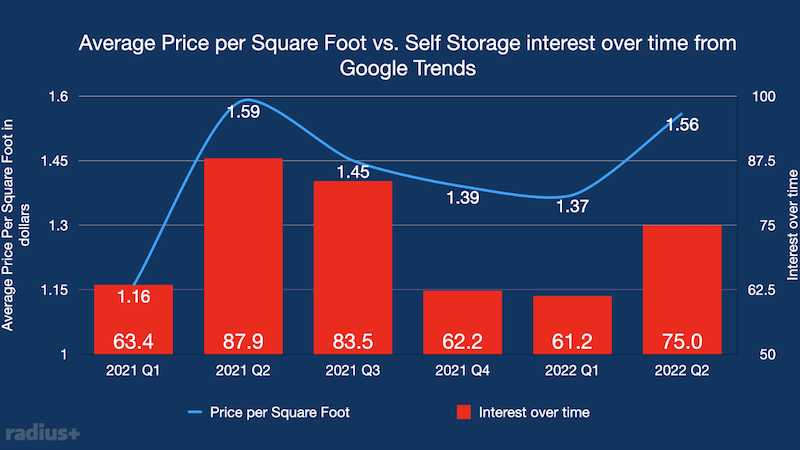
With Q2 having recently ended the Radius+ team gathered data from Google trends to gauge consumer sentiment towards Self Storage in the last 18 months and compared it to average price per square foot data sourced from Radius+.
Google Trends quantifies topics through their own metrics “Interest over time” defined on their website as:
The numbers represent search interest relative to the highest point on the chart for the given region and time. A value of 100 is the peak popularity for the term. A value of 50 means that the term is half as popular. A score of 0 means there was not enough data for this term.
We saw that with higher interest over time in the topic of Self Storage there was a higher average price per square foot. In the last 18 months the average price per square foot peaked in Q2 2021, it was slightly lower in Q2 2022 alongside a lower interest over time in the topic of Self Storage, as per Google Trends.
Average price per square foot has always been a strong indicator of current and past demand for Self Storage, but according to this data, there is also strong correlation between the interest over time in the topic of Self Storage from Google trends and rates.
The relationship shows that the more online buzz and searches for the topic of Self Storage, the higher the average price per square foot. With web searches being such a strong indicator of demand, it is more important than ever for Self Storage facilities to have an online presence.